Workforce capacity for risk-targeted melanoma screening in Australia: findings from 12 years of national workforce data
We linked the National Health Workforce Dataset (2013–2025; 124 tables), the Australian Cancer Atlas, Medicare item statistics and ABS population data to ATOF's risk-threshold model. In summary: Australia has the clinician time to run targeted screening. What it lacks is dermatologists in the right places, and a delivery model that uses the primary-care workforce where the dermatologists are not.
Clinician time required for screening, by workforce and delivery model
Checking everyone above a 3% ten-year risk (QSkin MP16) every two years means 424,000 checks a year: about 106,000 clinician hours for the checks themselves, the time of roughly 58 full-time clinicians. That is 11% of all dermatologists' clinical time, but only 1.5% of skin-cancer GPs', 0.2% of all GPs' and 0.6% of practice nurses'. Regionally, dermatologists alone would need more than all of their local time in 15 of 88 regions; no region would need more than 2.5% of its practice nurses' time.
| Delivery model (Workforce Lab, 3%, ≤10% of any workforce's time) | Regions that can deliver | With state teledermatology pooling |
|---|---|---|
| Dermatologist-led | 42 / 88 (58% of adults) | 42 / 88 (58% of adults) |
| Skin-cancer GP-led | 85 / 88 (96% of adults) | 88 / 88 (100% of adults) |
| Shared primary care (skin GPs, GPs, practice nurses) | 85 / 88 (96% of adults) | 88 / 88 (100% of adults) |
| Nurse photography + AI triage + tele-review | 87 / 88 (98% of adults) | 88 / 88 (100% of adults) |
2024 supply; checks every 2 years; 50% of the adults offered checks attend; 5% of GP and nurse checks referred to a dermatologist; 10% of photography checks flagged by AI for a 5-minute tele-review, with 50% of the flagged adults then seeing a GP for a procedure. Clinician time includes the biopsies, excisions and results consultations that follow checks. Regions with 3 or fewer dermatologists are published only as a band, and the tool places each inside its band: with every such region at the bottom of its band 60 regions could deliver shared primary care in-region, and at the top 88. All levers are adjustable live in the Workforce Lab.
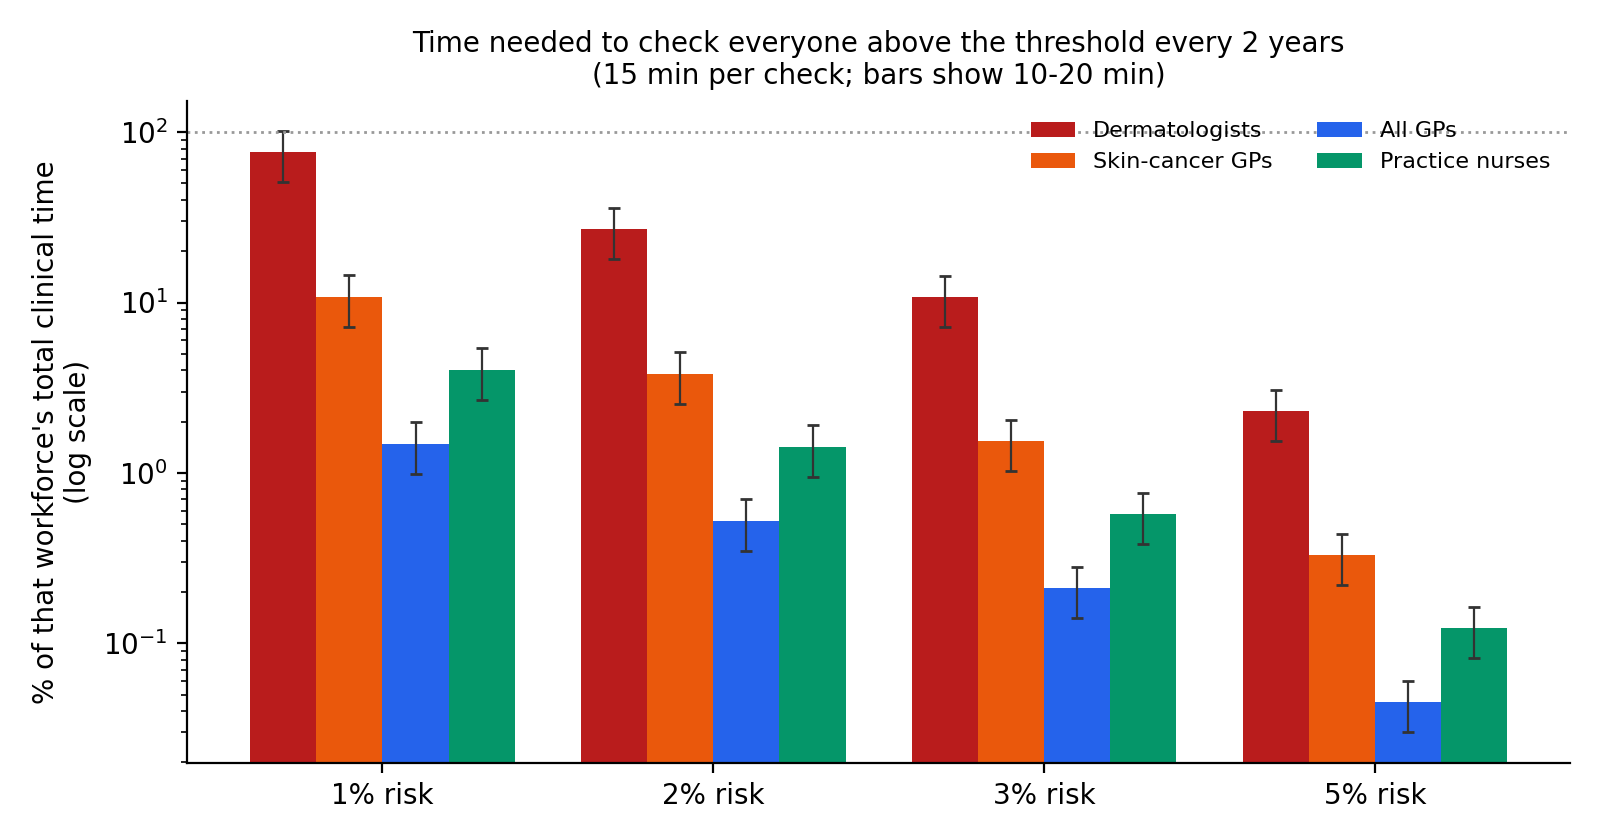
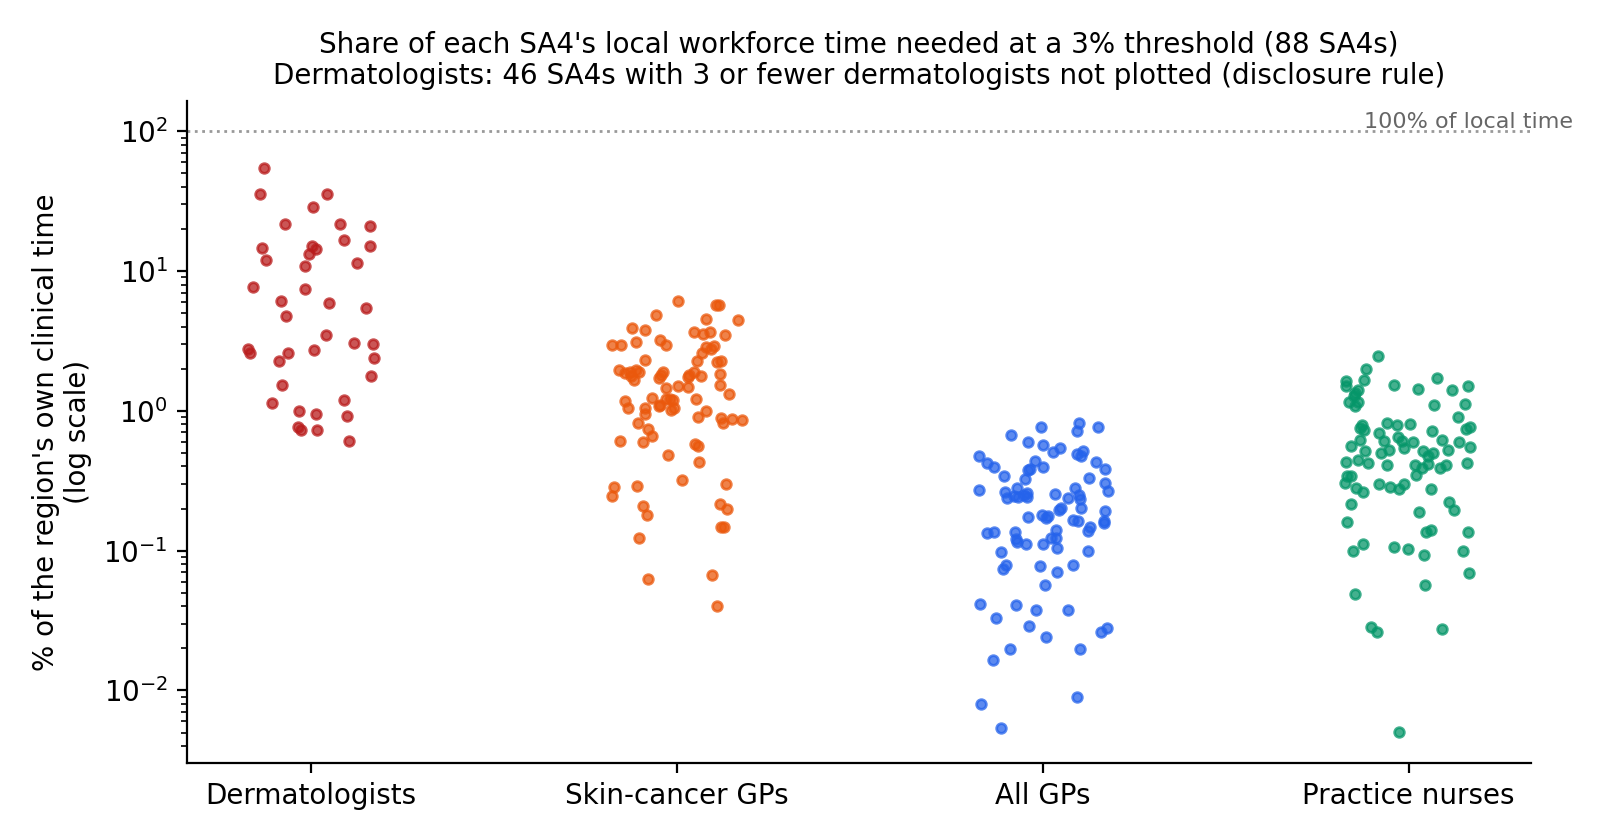
For statisticians: Demand = eligible adults 40+ × P(predicted risk > t) under a binormal risk distribution at the model's external AUC, with SA4 average risk = 1.25% (national average 10-year risk of a first invasive melanoma, adults 40+) × age-standardised invasive SIR × 40+ age mix; divided by the check interval. Supply = NHWDS clinical FTE (hours/40) by main-job SA4, 2024. Minutes per check (15; 10–20) is a labelled assumption. Demand matches the tool's own demand model to within 2 people (847,000 people above 3%). Hours are for first-line checks only, at the same minutes whoever does them and with everyone attending. The Workforce Lab differs: it takes a nurse check as 25 minutes and a photography session as 30, adds dermatologist time for referrals and clinician time for the biopsies, excisions and results consultations that follow checks, and assumes 50% attendance by default.
Primary-care workforce in regions with few dermatologists
46 of 88 regions have three or fewer dermatologists and are home to 37% of adults aged 40+. Per person, they have 0.13× the dermatologists of the rest of Australia, but 1.43× the practice nurses, 0.89× the skin-cancer GPs and 0.88× the GPs. Screening at 3% there would take 0.6% of local practice-nurse time.
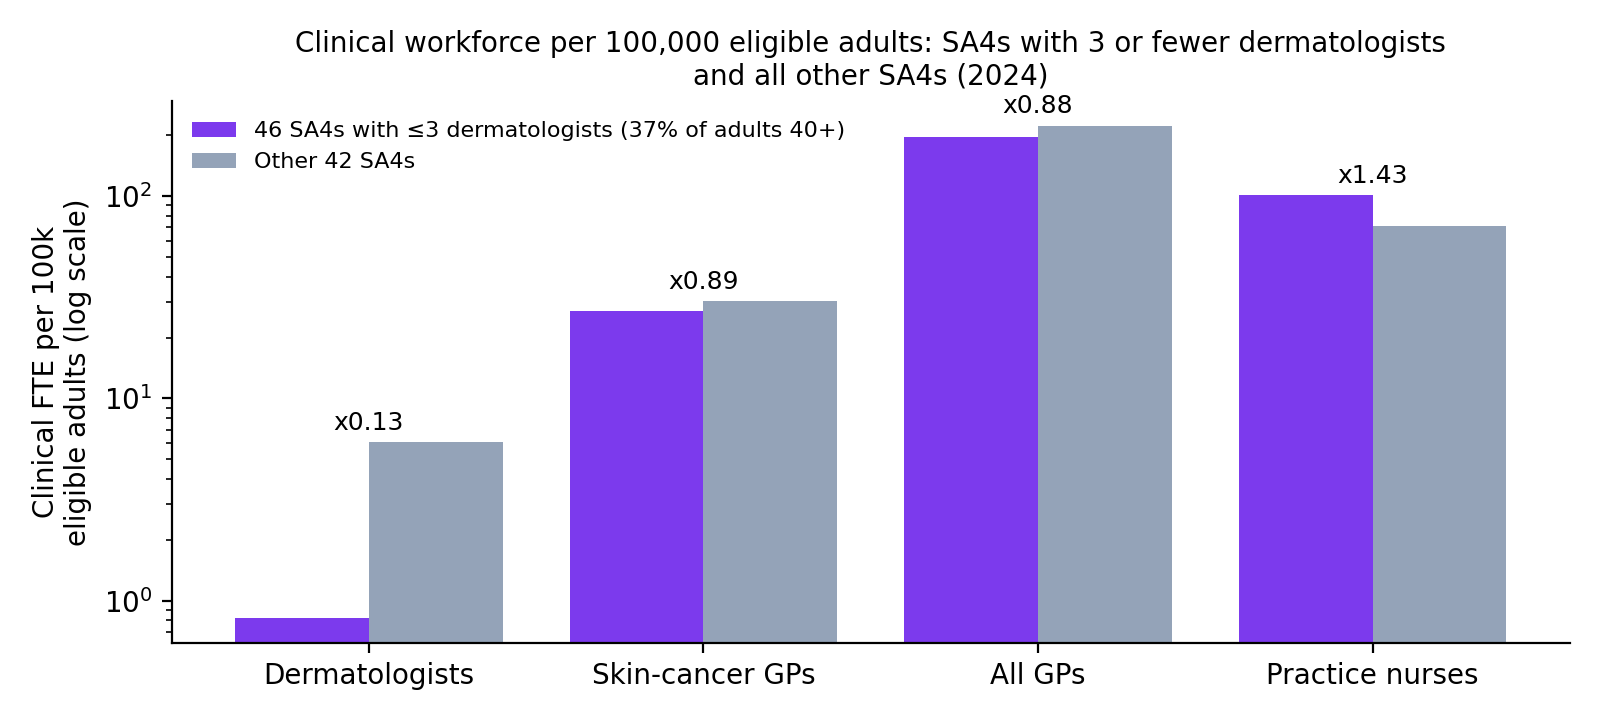
For statisticians: Practice nurses = NHWDS nurses whose main job area is primary care ('Practice nursing' until 2020, recoded in 2021). Dermatologist values for regions with ≤3 dermatologists are never shown individually (disclosure control); the group total is the published national total minus published regions.
Dermatology workforce: growth, distribution and composition, 2013–2024
Dermatologist clinical FTE per capita grew 1.72% a year (95% CI 1.51–1.94) over 2013–2024, below the 3% a year this tool previously assumed (which matches growth in total, not per-capita, FTE): headcount grew 3.6%/yr, but hours per head fell and the population grew. On published clinical hours, 22 of 88 regions (2024; 20 in 2023) have no meaningful main-job dermatologist hours (0–3 h/week). Counting published zero cells instead, which are perturbed, gave 33 in this tool's earlier table; the two counts use different definitions. Capital cities hold 85% of dermatologist hours but 68% of the population (SA4 Gini 0.57). From 2013 to 2024 the share aged 65+ rose from 11.6% to 15.7%, women from 41.5% to 54.5%, and overseas-trained from 11.9% to 16.6%. In 2012, 20.5% of dermatologists did regional outreach, but it was only 2.6–7.3% of their hours.
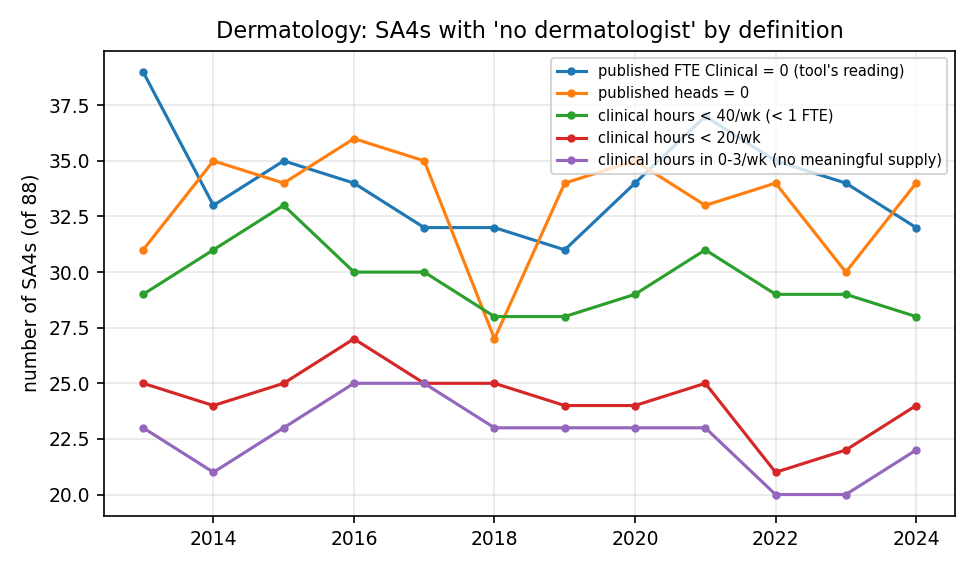
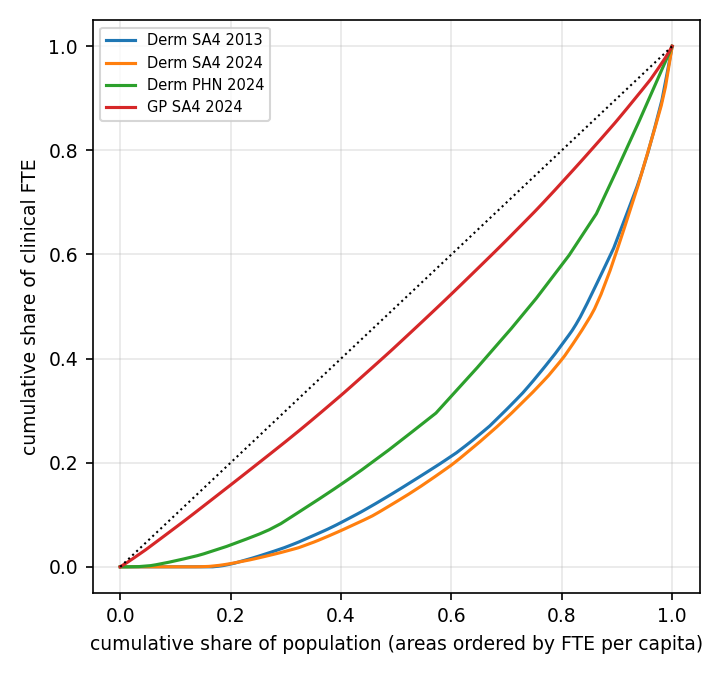
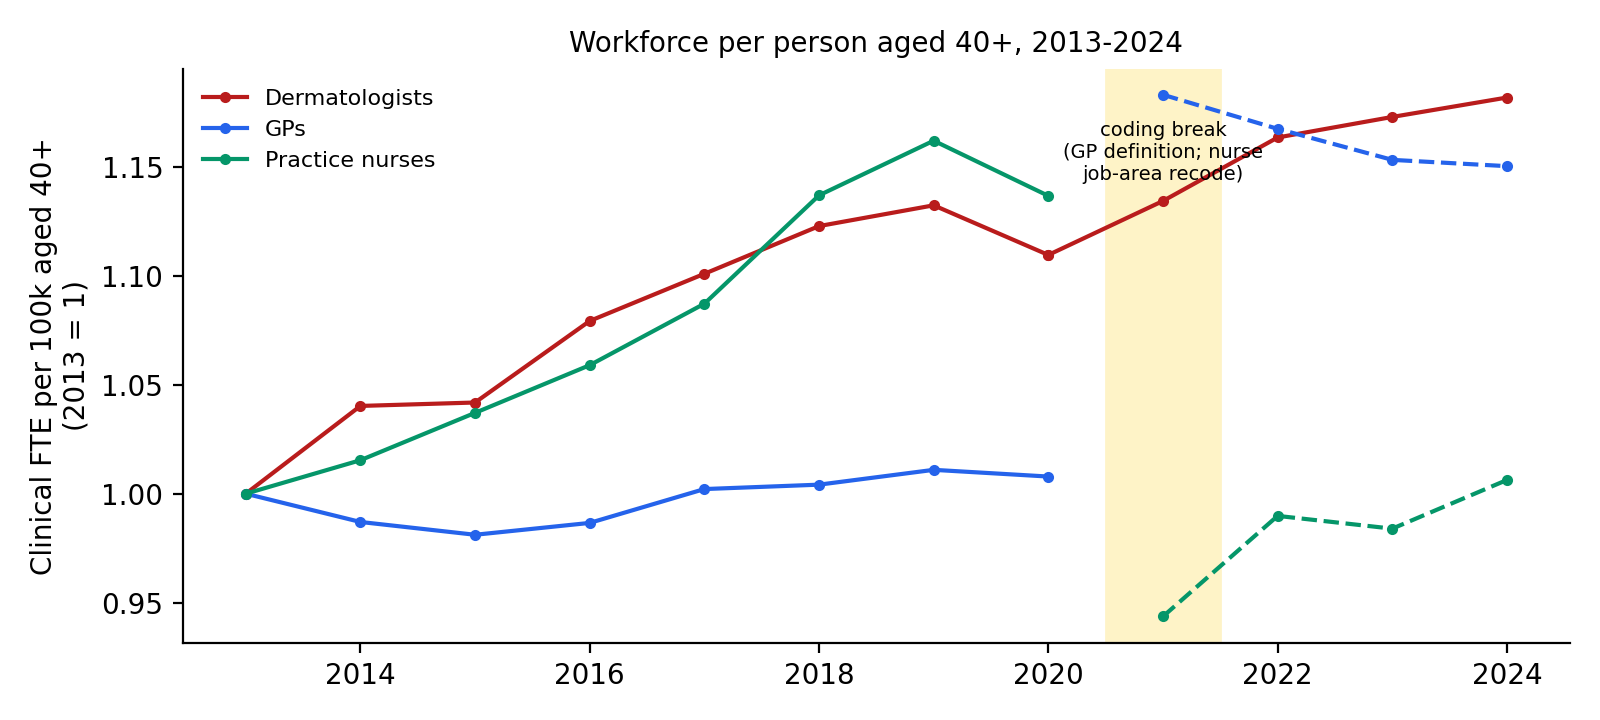
For statisticians: Confirmatory test pre-specified before analysis (per-capita growth vs 3%/yr): rejected. NHWDS cells of 0–3 are perturbed; hours are effectively unperturbed at SA4 (SA4 sums match published totals within 1 hour). Outreach is from the survey-weighted 2012 workforce data, the only year with an outreach question.
Workforce projection to 2040 and hindcast comparison
A pre-specified cohort-component model (fit 2013–18, forecast 2019–24) did worse than a flat 3% FTE trend (state-group MAPE 11.6% vs 6.3%), so the flat trend was kept, with empirical intervals. What matters most is the population the 3% is applied to: against ABS population projections, dermatologist FTE per person in 2040 is 1.35× today (80% 1.20–1.50), not the 1.60× obtained when the population is held at today's level. GP supply per person aged 40+ is flat.
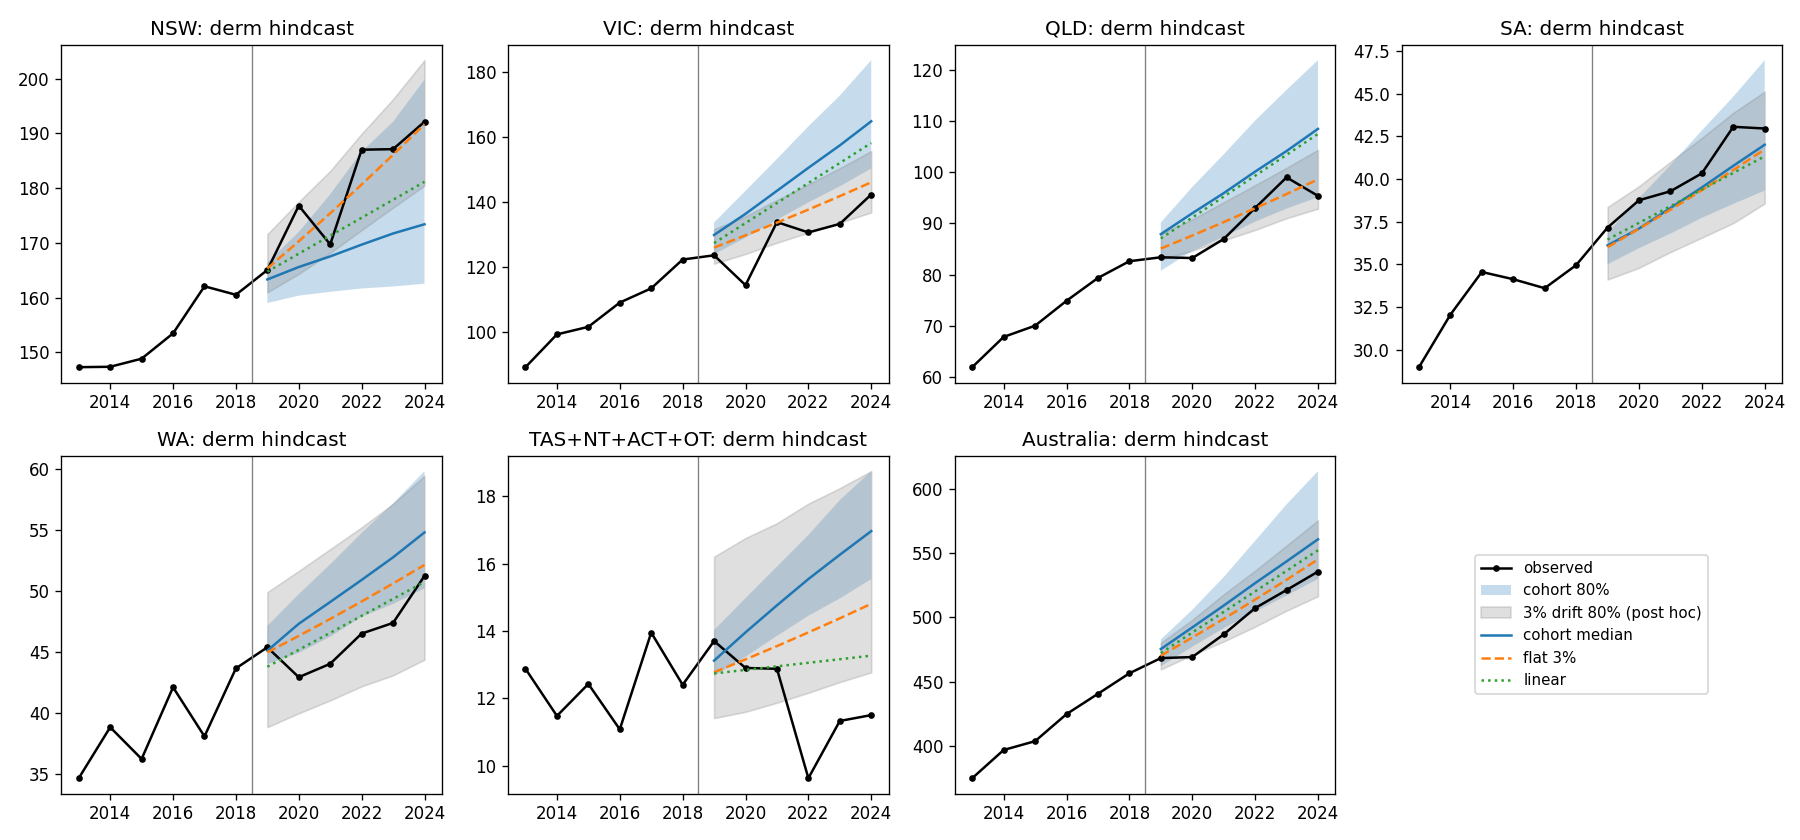
For statisticians: Decision rule stated before running: use the model with the lower hindcast MAPE. Hindcast coverage of the reported 80% interval: 83%.
Medicare procedure data do not identify the skin-cancer share of clinician time
Fitting skin-cancer time shares to Medicare procedure volumes by state, the data barely move the priors (dermatologist share: posterior SD 0.97× the prior SD). What the data do show: Queensland has 1.80× (95% 1.44–2.24) the Medicare skin-cancer procedures per skin-cancer FTE of the other states, where skin-cancer FTE is estimated by applying the Queensland method of Lindsay 2026 to every state. Queensland's higher lesion burden could explain much of this (across the eight states and territories the pattern follows melanoma incidence, r = 0.92, an exploratory check). The data cannot separate more lesions per clinician hour from more clinician time, and the result does not show that the Lindsay 2026 method underestimates Queensland's skin-cancer workforce.
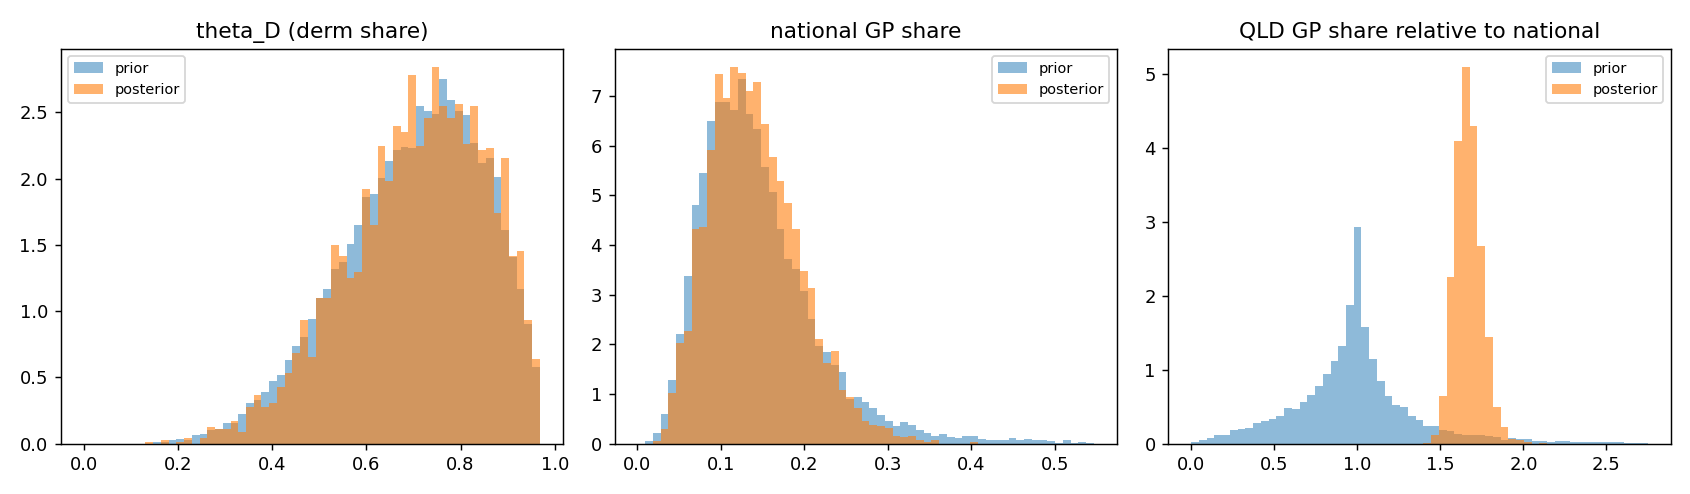
For statisticians: Bayesian model of MBS volumes (state × item, 10 months) on NHWDS private clinical hours (NumPyro, 0 divergences). Pre-specified rule: a share counts as 'calibrated' only if posterior SD ≤ 0.5 × prior SD. The 1.80× ratio rejects a joint null (the Lindsay-method state distribution and equal procedures per skin-cancer hour in every state), not either part alone.
Dermatologist access and the in situ:invasive melanoma ratio (pre-specified null result)
Across 2,234 small areas, within states, the elasticity of the in situ:invasive melanoma ratio to dermatologist access is +0.011 (95% CI −0.008 to +0.029): doubling access goes with at most about +2% in the ratio. Ophthalmology access (a negative control) shows an association at least as large. The big differences are between states (ACT records about half the in situ melanoma per invasive case of Queensland), which reflects registries and practice, not local supply.
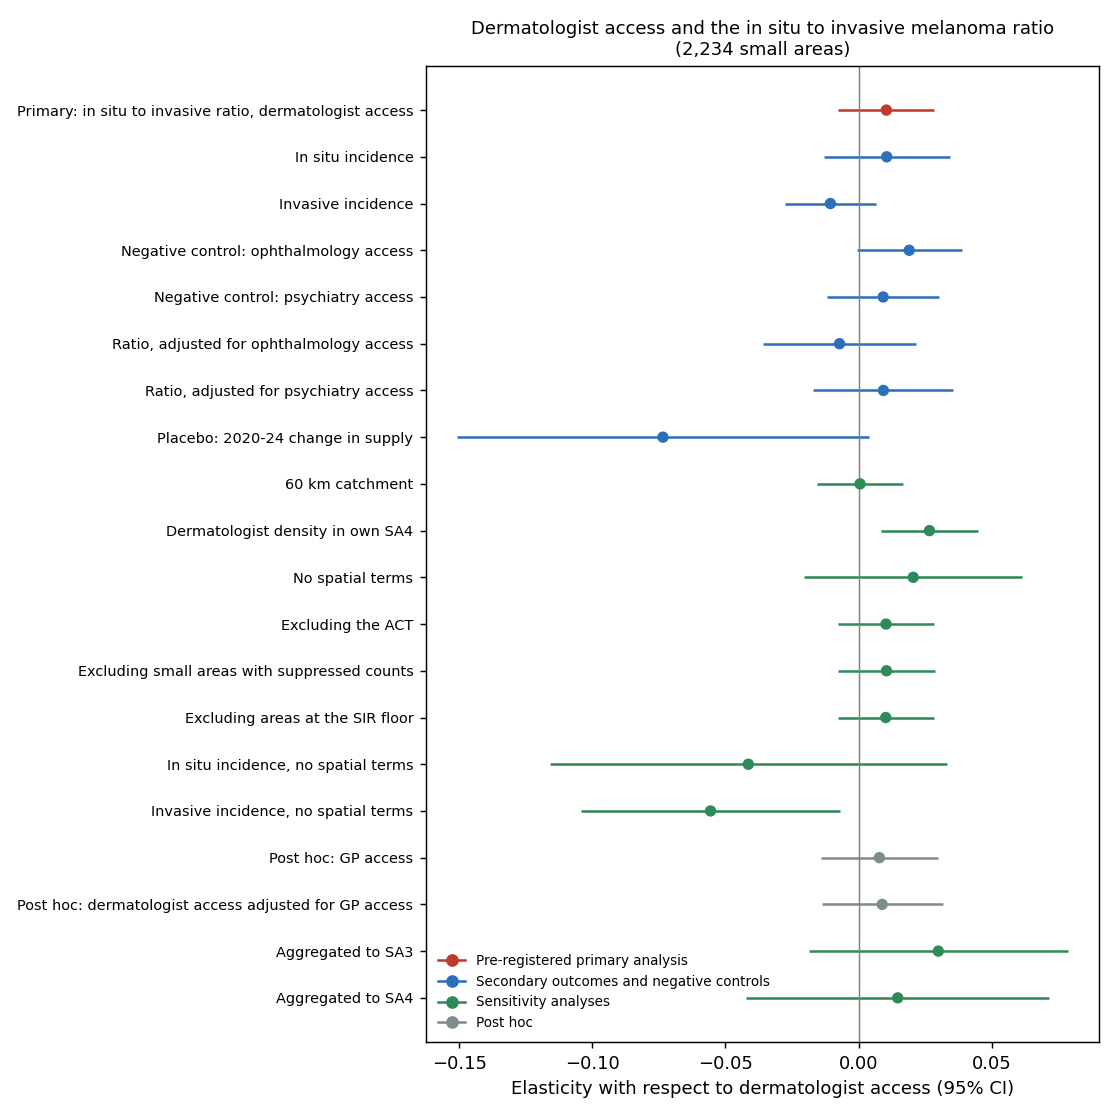
For statisticians: Spatial linear mixed model (REML) with state fixed effects, IRSAD and remoteness, Atlas measurement error; E2SFCA access (120 km); 2013–19 supply aligned to 2010–19 outcomes; FDR over the named secondary tests; Moran's I of residuals 0.095.
Implications for the screening threshold in ATOF
Using external-validation accuracy (AUC 0.69 for QSkin MP16, not the development AUC of 0.76), screening at 3% checks about 7% of adults 40+ and finds about 23% of future melanomas, with each region's own melanoma risk allowed for. With overdiagnosis counted, net benefit at 3% is negative if 54% of screen-detected melanomas are overdiagnosed (the published estimate for all melanomas, in situ included), close to zero at 28% and positive at the 15–22% estimated for invasive melanoma. The overdiagnosis rate for screen-detected melanoma is the most decision-relevant unknown, with the GP skin-cancer time share and the share of clinician time available for screening. Net benefit weighs melanomas found against people checked. It does not count cost or deaths averted: on value for money (finding 8), a threshold this low is far from good value.
For statisticians: Sensitivity at each threshold comes from the binormal model at the external-validation AUC. The Threshold Advisor propagates the uncertainty of every input by Monte Carlo in the browser and ranks what drives each region's answer.
Cost-effectiveness of targeted GP skin checks, per person and nationally
On the 2026 reference case of cost model version 2.0 (2026 prices, immunotherapy era, published PBS prices, treatment savings counted), the preferred option at $50,000 per QALY is 5-yearly GP checks from 12% and 2-yearly GP checks from 20% of ten-year risk, and usual care (today's skin checks) below that. Per person, against usual care and with each risk band weighted by the adults in it, this policy saves money and gains health, and it is cost-effective in 42% of probabilistic draws. The gain per person is very small, so in most draws usual care is the better choice. At the 12% starting point, 5-yearly GP checks cost about $12,000 per QALY; from 20% upwards the preferred checks save money. If all of the observed stage shift is real (not lead time) the starting risk is 8%; if only 50% of it is real, usual care is preferred at every risk. Specialist 6-monthly total-body photography is never preferred at population level. In the model 37% of adults already have a skin check every year. Programme checks replace those checks, so the health gain comes from adults who are not checked today. About 50% of the melanomas diagnosed today are overdiagnosed (55% are in situ), and more checks find more of them. A melanoma that would never cause harm stays detectable for much longer than one that would progress (10 years on average against 2, both assumptions), so 5-yearly checks find about 72% of the first kind but only 30% of the second. With 2-yearly checks from 3% a programme adds about 69 overdiagnosed melanomas for each melanoma death it averts, and with 5-yearly checks about 104. National figures also pay to risk-assess every adult 40+, assume that 50% of the adults offered checks attend, and depend on how many adults are above the threshold. A programme from 3% also checks the many adults between 3% and 12%, for whom usual care is the better option at $50,000 per QALY. At the national average 10-year risk (1.25%), the Workforce Lab's national cost panel gives about $17,370,000 per QALY for 5-yearly skin-cancer GP checks from 3% with annual checks from 20% (about $18,571,000 per QALY when 5% of checks are referred to a dermatologist), and for shared primary care from 3% no health gain with 5-yearly checks and about $2,422,000 per QALY with 2-yearly checks (about $17 million a year net, with $50 million of melanoma treatment avoided over 10 years, offsetting 26% of the programme's cost). Risk-assessing every adult 40+ ($5 per adult, one round in the 10-year programme, about $65 million) is the programme's fixed cost: without it the four options come to about $5,211,000 per QALY, about $6,412,000 per QALY, no health gain and about $1,395,000 per QALY. In a higher-risk population (average risk 2%, close to the Queensland QSkin cohort) more adults are above the threshold and, with the risk assessment counted, the four options come to about $4,073,000 per QALY, about $4,614,000 per QALY, no health gain and about $1,190,000 per QALY. None of these national results is under $50,000 per QALY. In shared primary care, 5-yearly checks from 3% avert melanoma deaths, but overdiagnosis, biopsies and excisions take away more health than that adds; 2-yearly checks have the lowest cost per QALY of the intervals offered. With shared primary care, a programme costs less than $50,000 per QALY only from a threshold of 8.5% with 3-yearly checks (less than $100,000 from 7.5%), because it then reaches only adults at high risk, and only when risk assessment costs nothing; at $1 per adult no threshold is under $100,000 per QALY at any interval. All dollar figures are Australian dollars. Illustrative until the stage shift is calibrated to Policy1-Melanoma.
For statisticians: Stratified cost-utility model, version 2.0, 2026 reference case (10-year programme, lifetime consequences, 5% discounting, health-system perspective, 2026 prices, published PBS prices). Usual care: 37% of adults have a whole-body skin check every year and the rest have none (National Sun Protection Survey 2016-17: 37% of adults 45-69 had a whole-body skin check in the past 12 months (Reyes-Marcelino 2021); 43% in the 45 and Up Study 2020 (Reyes-Marcelino 2026)); each check is followed by a biopsy in 8.3% and a benign excision in 8.0% (Goldsbury 2024). Programme checks replace a regular checker's own checks one for one, and are spread evenly over the programme. The share of progressive melanomas found by a check before they would surface is 30% with 5-yearly checks, 55% with 2-yearly checks and 72% with yearly checks (mean detectable period 2 years, sensitivity of a check 0.8; both assumptions). An overdiagnosed melanoma stays detectable for longer (10 years on average, an assumption), so a check finds more of them: 72% with 5-yearly checks, 87% with 2-yearly checks and 93% with yearly checks. Melanomas diagnosed under usual care follow Australian registries (Australian Cancer Atlas 2010-2019 (persons): 165,641 in situ and 134,543 invasive melanomas; invasive melanomas by the national registry stage mix), with the overdiagnosed shares of Lindsay 2024 (melanoma in situ and thin invasive, stage IA, melanoma, the latter applied to all stage I as an ATOF extension): 50% of all melanomas diagnosed. Stage II or later melanomas fall in proportion to the share of progressive melanomas found by a check, and overdiagnosed in situ and stage I melanomas rise in proportion to the share of overdiagnosed melanomas found, scaled so that adults with 0.55 checks a year have stage II or later melanomas 0.74 times, stage I melanomas 1.29 times and in situ melanomas 1.45 times as often. Aitken 2010 (Int J Cancer 126:450-8): whole-body clinical skin examination in the 3 years before diagnosis; melanomas 1.5 mm or thicker (two thickness groups pooled), odds ratio 0.74 (0.61-0.90). Examined adults taken to have 0.55 checks a year (Janda 2004: 11% examined in 12 months, 20% in 3 years). Aitken 2010: odds ratio 1.38 (1.22-1.56) for melanomas 0.75 mm or thinner and 0.93 (0.79-1.10) for 0.76-1.49 mm; combined 1.29 for melanomas under 1.5 mm (those 0.75 mm or thinner taken as 80%). Whiteman 2022 (Br J Dermatol 187:515-22), QSkin: in situ melanoma 1.45 (1.09-1.92) times as common in adults whose skin was examined by a doctor in the previous 3 years. A melanoma found earlier is found in situ or at stage I (50% in situ, an assumption). Overdiagnosed melanomas are costed at the price of their stage. Treatment costs: treatment at the stage found (full credit), plus an advanced-melanoma episode (immunotherapy or targeted therapy, built from PBS items at PBAC mean durations) for each stage IV diagnosis or relapse, counted as realised deaths ÷ P(death | advanced), plus end-of-life care (Goldsbury 2026, excluding medicines). Survival is 10-year melanoma-specific survival by stage per progressive melanoma (published mortality divided by the share of that stage's diagnoses that are progressive), scaled by one factor (k = 0.76) so that melanoma deaths per invasive melanoma diagnosed under usual care are 8.3% (AIHW deaths ÷ invasive diagnoses). Stage-shift benefit computed on progressive melanomas only and scaled by a lead-time realisation factor (base 0.75, PSA 0.5–1.0). QALYs count life lost to melanoma death, time lived with advanced melanoma (0.3 per episode), each overdiagnosed melanoma (0.05) and each biopsy or excision after a check (0.0011). The risk score predicts diagnosed invasive melanoma; the melanomas that would progress are counted as 1.11 for each invasive melanoma diagnosed under usual care (22% of invasive diagnoses are overdiagnosed, and 30% of progressive melanomas are found in situ). The range for the starting risk is realisation 50% to 100% at $50,000 per QALY. Shared-draw PSA, 600 draws, each risk band weighted by the adults in it. National figures: Workforce Lab cost panel at 50% attendance, which includes risk assessment of every adult 40+ ($5 per adult, one round every 10 years, a fixed cost), at the national average 10-year risk of a first invasive melanoma for adults 40+ (1.25%; AIHW 2025 incidence, ABS 2025 population) and, for a higher-risk population, at 2%.
How the analyses were done
- Confirmatory tests and decision rules were written down before any model was run; null and negative results are reported alongside positive ones.
- Every number traces to an analysis script and an input file, and is listed in a numbers ledger in each analysis report.
- Disclosure control is respected: perturbed small cells are never reconstructed, and regions with three or fewer dermatologists are shown only as bands.
- Limits: area-level (ecological) data; clinicians counted where their main job is; minutes per check and referral rates are scenario assumptions; not yet peer reviewed.